Chapter 7
The figure shows the effect of the construction boom. The construction boom increases the supply of housing. Thus, the housing supply curve shifts rightward, from S0 to S1. As the supply increases, the rent falls and the quantity of housing increases. The figure is drawn so that eventually the supply increases to the point where the rent is driven back to its initial level ($400 per month) and the quantity of housing increases to 70,000 per month. The conclusion that the rent returns to its initial amount is not always going to be the case. Depending on the cost of constructing housing, the rent may end up above its initial level, equal to its initial level (as in the figure), or, though unlikely, below its initial level. But, the important points are:
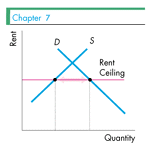
How would the presence of a rent ceiling affect these conclusions? Click on the figure below to find out.
|
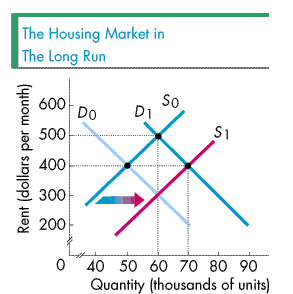 After the increase in demand, rents
initially rose to $500 per month. At this higher
level, it now becomes more profitable to construct
more housing. Thus, an apartment and housing
construction boom will hit the city. Of course, it
takes time to build the additional housing. But, as
time passes, more housing is produced and so the
supply of housing increases.
After the increase in demand, rents
initially rose to $500 per month. At this higher
level, it now becomes more profitable to construct
more housing. Thus, an apartment and housing
construction boom will hit the city. Of course, it
takes time to build the additional housing. But, as
time passes, more housing is produced and so the
supply of housing increases.