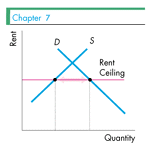
Chapter 7
The increase in population increases the demand for housing. The demand curve for housing shifts rightward, from D0 eventually to D1 in the figure to the left. This shift is exactly the same as before. The rent ceiling, however, now prevents rents from rising. As a result, the rent remains at $400 a month. At $400 a month, there is no incentive to increase the quantity supplied of housing units. In other words, unlike the case in which the rent was free to rise, the quantity does not increase to 60,000. Instead, the quantity stays at 50,000 units. At the rent of $400 a month, there is a shortage of 20,000 units. (After the increase in demand, at the going $400 a month rent, renters want to rent 70,000 units but only 50,000 units are supplied.) The shortage is equal to the length of the light arrow in the figure. Thus, we see the immediate effect
of a rent ceiling. After the increase in demand,
there is a shortage of apartments. Not everyone who
wants to rent an apartment can find one! Is this
situation the end of the story? Or, is there a happy
outcome? To find out, click on the figure below.
|
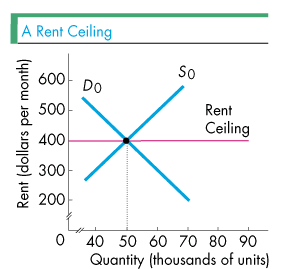 A rent ceiling sets the
highest rent that is legal to charge. In the figure
to the right, the rent ceiling equals the initial
equilibrium price, $400 a month. Because the ceiling
rent equals the equilibrium rent, there is no effect
from the ceiling. Thus, the rent equals $400 a month
and 50,000 units are rented. Now, with the rent
ceiling in place, let's reexamine what happens when a
population boom hits the city.
A rent ceiling sets the
highest rent that is legal to charge. In the figure
to the right, the rent ceiling equals the initial
equilibrium price, $400 a month. Because the ceiling
rent equals the equilibrium rent, there is no effect
from the ceiling. Thus, the rent equals $400 a month
and 50,000 units are rented. Now, with the rent
ceiling in place, let's reexamine what happens when a
population boom hits the city.