Chapter 24

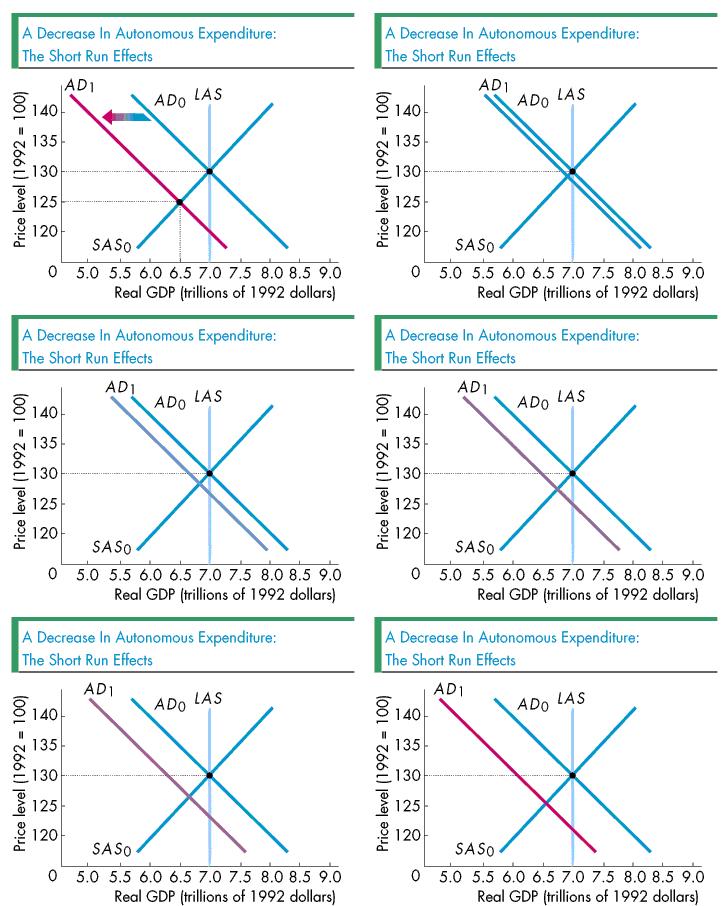
The figure shows the impact of a decrease in autonomous expenditure on aggregate demand. The decrease in autonomous expenditure decreases aggregate demand, so the aggregate demand curve shifts leftward from AD0 to AD1. When the price level is fixed, the decrease in autonomous expenditure decreases equilibrium expenditure and aggregate demand by $1.0 trillion. You can see that aggregate demand decreases by $1 trillion by using the dotted line at the price level of 130. Note that when the aggregate demand curve stops shifting, aggregate demand at this price level has decreased to $6 trillion, a decrease of $1 trillion from $7 trillion. Thus the multiplier effect of the decrease in autonomous expenditure when the price level is constant is $1 trillion.
The multiplier effect on aggregate demand is $1 trillion. But as neither the long-run aggregate supply curve (LAS) nor the short-run aggregate supply curve (SAS0) has shifted, the decrease in agregate demand, as the figure shows, decreases real GDP by $0.5 trillion, from $7.0 trillion to $6.5 trillion. The price level falls, from 130 to 125. That is, real GDP changes by less than the change in aggregate demand.
Hence in the short run, the multiplier effect of the change in autonomous expenditure on real GDP is less than the multiplier effect of the change in autonomous expenditure on aggregate expenditure. But, what is the multipler effect in the long run? Will the multiplier effect in the long run be larger or smaller then it is in the short run? To answer these questions, click on the figure.