|
|
Chapter 24
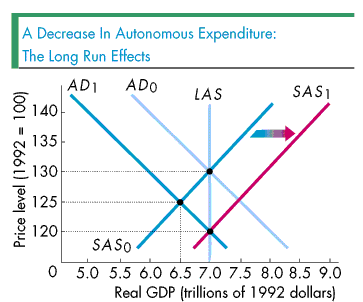
In the short run, the money wage rate does not change. So when aggregate demand changes, the economy moves along its short-run aggregate supply curve. But, as time passes, the money wage rate starts to adjust as the price level changes and the short-run aggregate supply curve shifts. Thus in the case in which the price level falls, the money wage rate eventually adjusts to the lower price level by falling. As the money wage rate falls, firms increase the quantity of goods and services they produce and short-run aggregate supply increases.
The figure illustrates these long-run adjustments: The short-run aggregate supply curve shifts from SAS0 to SAS1. The aggregate demand curve remains at AD1. Ultimately, the short-run aggregate supply curve increases by enough for real GDP to return to potential GDP. At this point, the long-run equilibrium has been reached and the economy is on its long-run aggregate supply curve, LAS. Thus we see that in the long run, real GDP returns to its original level: It starts at $7.0 trillion and then ultimately returns to $7.0 trillion. In the long run, the price level falls by more than it did in the short run, to 120 in the figure.
The result that real GDP eventually returns to potential GDP means that in the long run, the multiplier of a decrease in autonomous expenditure on real GDP is . In other words, a decrease in investment or exports has no effect on real GDP in the long run!
For the summary, click on the figure below.
|
|