Chapter 21

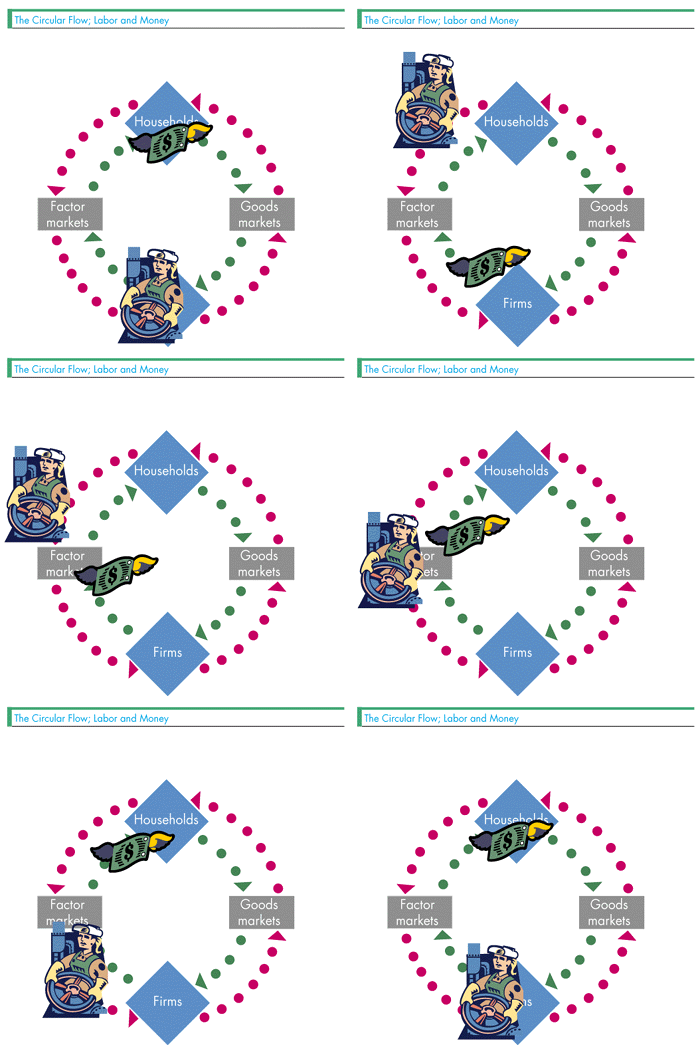
In general, the circular flow shows the flows of work
(or, more generally, flows of inputs) through factor
markets and the resulting flows of money payments for
the work (or inputs). In addition, it also shows the
flows of goods and services and the flows of the
money spent to purchase these goods and services in
the goods market as well as the flows of saving and
borrowing in financial markets. To present a circular
flow here, we have to make simplifications. First,
our simplified circular flow figure leaves out
the flows through the financial sector. Second, it
assumes that there is no government. That is, the
economy is make up of only households and firms. The
figure looks at the flows between households and
firms and does show firms buying goods from other
firms. (That is, firms' purchases of capital goods
are not illustrated.) However, none of the lessons
that the circular flow teaches us are affected by
these simplificactions.
The figure shows the flow of money from households
to firms in exchange for the flow of goods and
services. In other words, this figure shows us that
households buy the goods and services produced by
business firms. In this economy, the amount that
households spend is the nation's aggregate
expenditure. Also, if we measure the value of
these goods and services we get the nation's Gross
Domestic Product. That is, the nation's GDP.
Thus in this economy, the nation's GDP equals the
amount of dollars flowing from households to firms. Aggregate
expenditure equals GDP.
But, this figure by itself is incomplete. Two
important questions are left unanswered:
- How did the firms produce the goods and
services?
- And, where did the households get the money
to buy the goods and services?
For answers to these questions, we must look at
the second half of the circular flow by clicking on
the figure below.
|
