Chapter 21
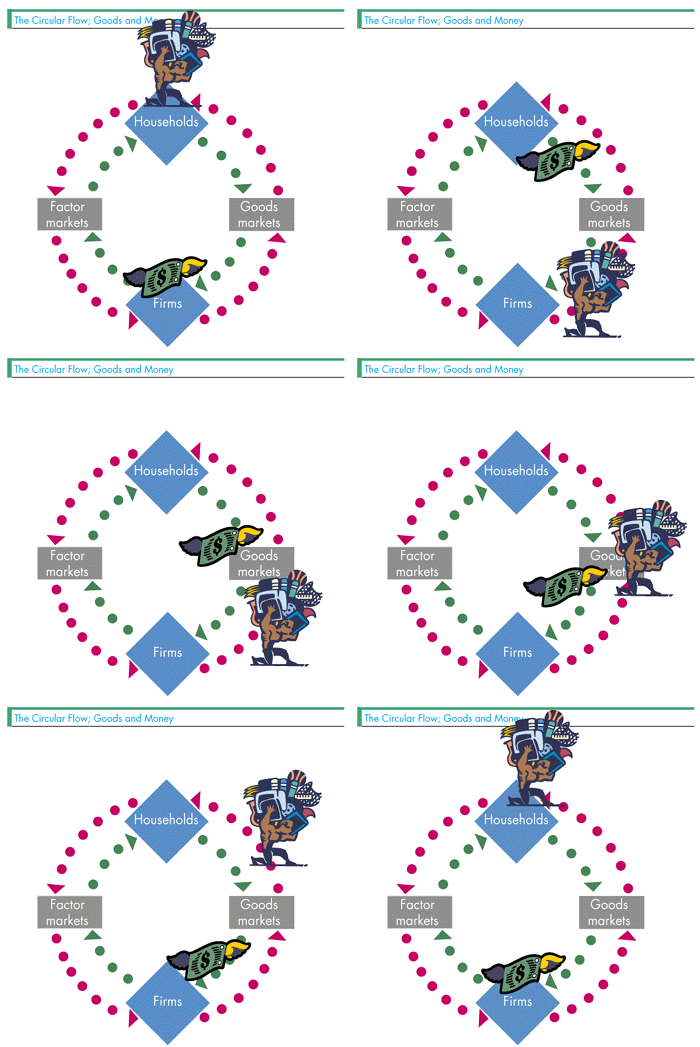
Remember that in the simplified circular flow diagram we are using, we are ignoring flows of saving and borrowing. Hence, households are spending all their income to buy goods and services. This result means that the "size" of the dollar note showing households' incomes in this figure is the same size as the dollar note showing their spending in the last figure. In other words, the amount of income households receive equals the amount they spend. Hence, aggregate income equals aggregate expenditure. The key equality between aggregate income and aggregate expenditure is easy to understand in the simplified circular flow we are using on this page. As the textbook carefully explains, the equality holds even in more complicated circular flow diagrams. Indeed, it is this equality that allows national income accountants to calculate GDP using either expenditure approach or the factor incomes approach! There is one last, important lesson to learn from the idea of the circular flow. Click on the figure below to move to the next page. |
