Chapter 18

Chapter 18 discusses some of the most important problems nations currently face: What should we do about pollution and what should we do to be sure that we generate enough knowledge? Both these questions are vitally important. Both reflect the role played by . And both may create a need for government action.
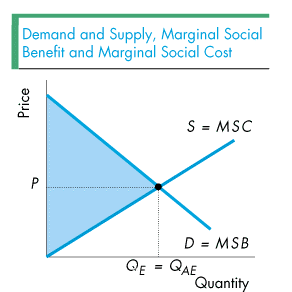
In a perfectly competitive market without externalities, there is no need for government action. As we learned in Chapter 11, the allocatively efficient level of output equals the equilibrium level of output. In other words, the amount of output produced (the equilibrium amount) is the allocatively efficient amount. The figure illustrates this result. The two lines in the figure are themselves two curves. The line labelled D =MSB is both the demand curve and the marginal social benefit curve. And the line labelled S =MSC is both the supply curve and the marginal social cost curve. When we look at the lines in the figure as the demand curve (the "D" part of the label) and the supply curve (the "S" part of the label) we see that the equilibrium level of output is QE. If we then look at the lines in the figure as the marginal social benefit curve (the "MSB" part of the label) and the marginal social cost curve (the "MSC" part of the label) we determine that the efficient level of output is QAE. Thus the figure demonstrates that the equilibrium level of output equals the allocatively efficient level of output.
The coloured area in the figure is the total surplus that the society gains from this product. Because the market is producing the allocatively efficient level of output, there is no deadweight loss, only the surplus. Hence the government need take no action to ensure that the surplus is maximized and the deadweight loss minimized.
This "Chapter 11 result" that the equilibrium quantity produced is the same as the allocatively efficient amount is a benchmark result. In Chapter 18, we now change one of the key assumptions we made in Chapter 11 and in the figure. In particular, as the figure shows, to give the conclusion that the equilibrium amount of output equals the allocatively efficient amount it is necessary that the demand and marginal social benefit curves be the same and that the supply and marginal social cost curves also be the same. What if the curves are not the same? What happens in this case? To find out, click on the figure below.
