Chapter 18
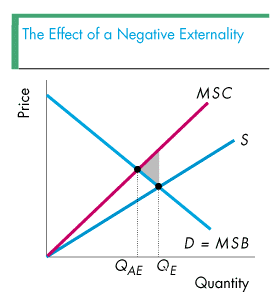
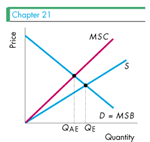
Suppose that production of a product creates a negative externality such as pollution. In this case, the marginal costs that producers pay, which determines their supply curve, is not the same as the marginal cost society must pay, which determines the marginal social cost curve. Thus as the figure on this page (and the figure in the text on page 19.8) shows, the MSC (marginal social cost) curve lies leftward of the S (supply or marginal cost) curve. Suppose that the marginal social benefits are the same as the benefits that each individual consumer receives. In this case, the marginal social benefit curve is the same as the demand curve and is illustrated as the MSB = D line in the figure. (In the case of knowledge, these curves are not the same because there is an externality from education. See Figure 18.7 on page 18.13 of the textbook for an illustration.)
The figure shows that the allocatively efficient level of output, QAE, is the same as the equilibrium level of output, QE. Too much output is produced and so a deadweight loss (illustrated by the grey triangular area) is created. The deadweight loss in this case indicates the loss from producing output for which the marginal social cost exceeds the marginal social benefit. The existence of the deadweight loss indicates that the negative externality hurts society.
The existence of a deadweight loss indicates that government intervention may be useful to eliminate the deadweight loss. To see the effects of one such intervention, click on the figure below.