Chapter 12
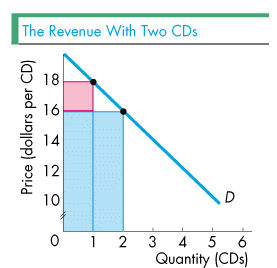
 The figure on the
right shows the revenue that the owners receive after they
lower the price to $16 for a CD. At the price of $16, they
collect $16 from Tommy for his CD (the first blue rectangle)
and $16 from Bobby for his CD (the second blue rectangle) for
total revenue of $32.
The red rectangle is important. It indicates that the
owners lose $2 of revenue from Tommy. How do the
owners lose $2 of revenue from Tommy? Before the owners
lowered the price, Tommy gave them $18, but after they lower
the price to $16, Tommy gives them only $16. The red
rectangle shows the loss of revenue from Tommy.
 Marginal revenue equals
the change in revenue when output changes. When the owners
lower the price they charge to $16 a CD, the number of CDs
they can sell increases from 1 to 2. Hence they increase
their output by 1CD. What is the change in their revenue?
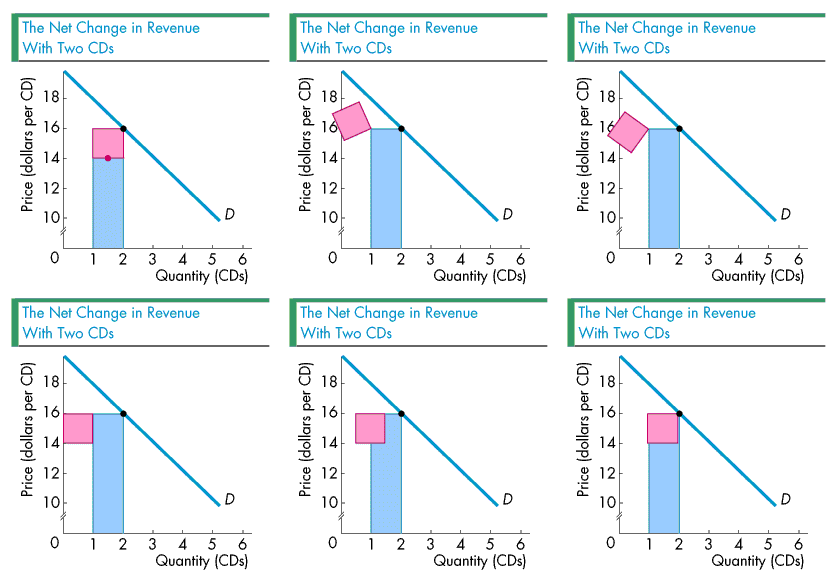
They receive an additional $16 from Bobby but lose $2 from
Tommy. The figure to the left shows that by subtracting the
$2 lost from the $16 gained, the net change in revenue
is $14. Hence the marginal revenue from increasing sales from
1 to 2 CDs is $14, as indicated by the red dot midway between
1 and 2 CDs.
The red dot in the figure shows that the marginal revenue going from 1 to 2 CDs, $14, is less than the price of a CD (which would be $17 at the point midway between 1 and 2 CDs). What if the owners lower the price some more to sell an additional CD? In this case is the marginal revenue still less than the price? To find out, click on the figure below.