Chapter 12
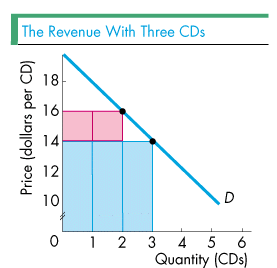
 At the price of $14
for a CD, the owners sell 3 CDs, as shown in the figure to
the right. The total revenue they collect is equal to the sum
of the three blue rectangles. They receive $14 from Tommy
(the first rectangle) plus $14 from Bobby (the second
rectangle) plus $14 from Kathy (the third rectangle).
The two red rectangles, however, are similar to the previous red rectangle: These red rectangles show the revenue lost from Tommy and Bobby. In particular, before the owners lowered the price to $14 to sell a third CD, they collected $16 from Tommy and Bobby. Now, with the price at $14 a CD, the owners collect $2 less from Tommy and $2 less from Bobby. Thus, while the owners gain an additional $14 from Kathy's purchase of a CD, they lose $4 from Tommy and Bobby.
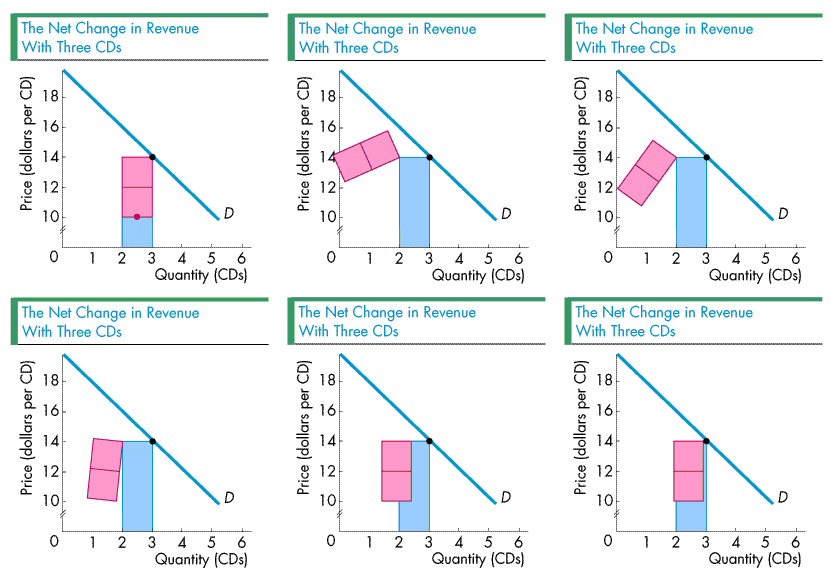
 As the figure to the
left shows, the net change in revenue is $14 - $4 or $10.
Thus, by selling one extra CD, the owner's revenue rises by
$10 so that the marginal revenue from this CD is $10. The
figure shows the marginal revenue with the red dot midway
between 2 and 3 CDs. Just as before, the marginal revenue is
less than the price.
We have just seen that up to 3 CDs, the price of a CD exceeds the marginal revenue from the CD. What is the general case? And what is the intuition why the price exceeds the marginal revenue? For answers, click on the figure below.