Chapter 12

A very important, and sometimes very easy to confuse, point in Chapter 12 is one of the first building blocks developed in the chapter on pages 4 to 8 in Chapter 12 of the textbook. The material on this page develops the connection between the price that a single-price monopoly charges for its output and the marginal revenue that the monopoly gains when it sells more output. The key relationship is that for a single-price monopoly the price, P, exceeds the marginal revenue, MR. That is, P > MR .
The fact that for a single-price monopoly the price is larger than the marginal revenue may seem odd; after all, for a perfectly competitive firm (which we studied in Chapter 11) the price equaled the marginal revenue. Why is a single-price monopoly different?

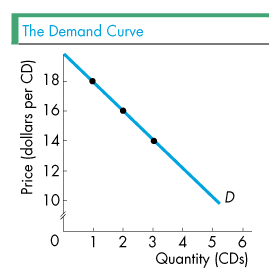
To understand this point, suppose that in a small town there is only one store selling compact discs, Mark and Sue's Music Shoppe. Because there is only one store, the owners, Mark and Sue, have a monopoly. With their monopoly, Mark and Sue can control the price of a CD. Suppose they are a single-price monopoly, that is, they charge everyone the same price for a CD. They discover that if they set a price of $18 for a CD, only one customer, Tommy, buys a CD. If they lower the price to $16 per CD, Tommy still buys one CD but Bobby also now buys a CD. Finally, if they lower the price still more, to $14 for a CD, they sell three CDs: Tommy, Bobby, and now Kathy each buys one CD. The figure on the right shows this demand for CDs. Thus the curve labeled D in the figure is the demand curve faced by the Music Shoppe.
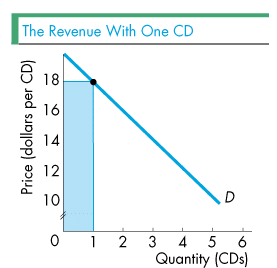
Mark and Sue start by setting the price of $18 for a CD. Then, as the figure on the left shows, one CD is bought. (Only Tommy buys a CD at this price.) The total revenue that they collect is $18, which is equal to the area of the blue rectangle in the figure.
Suppose that the owners lower the price to $16 per CD. By lowering the price, the owners will sell an additional CD. However, what is the marginal revenue from this second CD? To find out, click on the figure below.

