Chapter 30

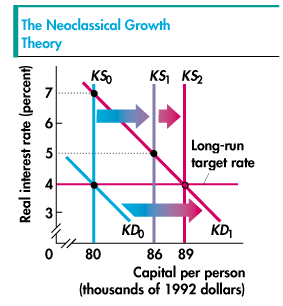
The figure shows the effect of another year's saving. The stock of capital increases, so the capital supply curve shifts rightward from KS1 to KS2. The capital stock increase further, from $86,000 per person to $89,000, and economic growth continues.
The increase in the stock of capital lowers the real interest rate. In the figure, the real interest rate falls to 4 percent a year and is equal to the long-run target interest rate. People stop saving! And the capital stock remains constant. Unless something else changes (for example, more technological advances occur) economic growth stops.

In the example just completed, technology advance caused the economy to grow for two years. Hence in the neoclassical growth model, a one-time advance in technology can temporarily increase the nation's economic growth rate, but it cannot permanently increase the economic growth rate. The neoclassical model concludes that to have permanent economic growth, advances in technology must occur year in and year out.

Neoclassical growth theory is one of the main topics explored in this chapter. Because it is such a major part of this very important chapter, the Study Guide to accompany the textbook has some additional explanation and questions that you can use to check your total understanding. Check out Learning Challenges. Then work Multiple Choice questions 15 to 19. If you have a complete grasp of the neoclassical theory, you should miss none of these questions.
Would you like to study another chapter?

