Chapter 22
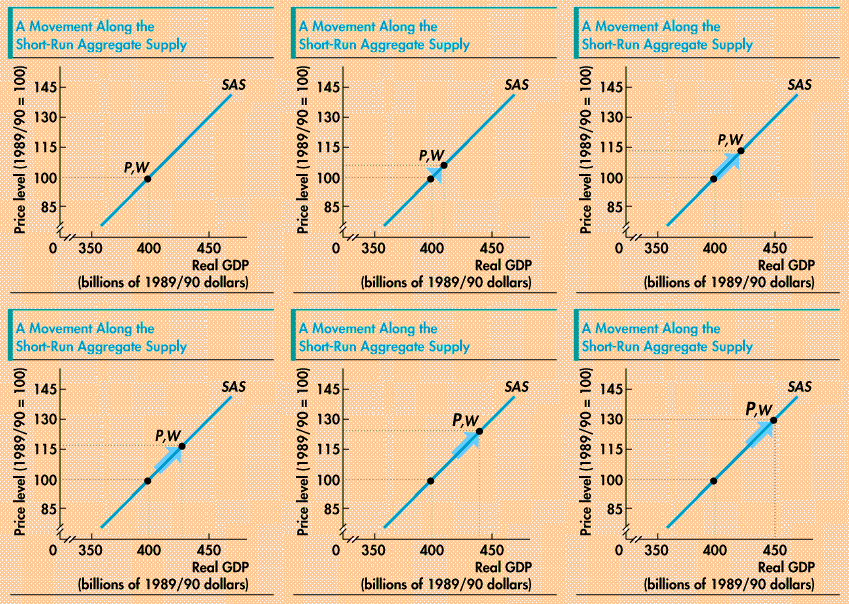
Why does GDP increase moving upward along the SAS curve? The figure indicates the reason: Moving along the SAS curve, the price level rises (as shown by the growing size of the P next to the moving arrow) but the money wage rate is assumed to remain constant (as shown by the constant size of the W next to the arrow). The basic economic idea is that in the short run, when the price level increases, the wage rate does not immediately change. Hence firms find that the prices they receive for their goods and services have increased but the wage rate they pay their workers has not changed. With prices rising and costs unchanged, firms find it profitable to produce more output. So firms respond by boosting their production of goods and services. The defining characteristic of the SAS
curve is that:
|
 The upward slope of the short-run
aggregate supply curve (SAS) means that as the
price level rises and the economy moves along its SAS
curve, real GDP increases. The arrow moving in the
figure shows this result. In the figure, the arrow
shows that as the price level rises from 100 to 130,
real GDP increases from $400 billion to $450 billion.
